|
Using the Value Equation to Evaluate Campaign Effectiveness.
William D. NealStefan BatheARF Advertising Tracking and Campaign Effectiveness Workshop
November 12-13, 1996
Introduction
For any product or service category, brand choice is a direct outcome of each consumer's estimate of the relative values of products in their consideration set. That is, choice is a function of consumers' individual value equations.
The effectiveness of advertising and promotional campaigns can be judged by:
- whether the campaign increased the number of consumers who would consider the product or service, and/or
- whether the campaign improved the value of the product or service in the consumers' collective mind or in a targeted segment, thus increasing the number who would choose the product or service.
Measurement of the first objective is fairly standard and straight forward.
Measurement of the second objective can be very complex and challenging.
In this presentation we present an operational model for measuring the extent to which a promotional campaign changes buyers' product evaluations, their value equation, and their share of choice.
The model uses a set of modified conjoint procedures whereby we present alternative bundles of benefits to shoppers in the product/service category, and derive preference both before and after the campaign. Furthermore, by presenting a set of choice tasks based on the conjoint results, we discern consumer brand choice in the category. This information then allows us to link changes in choice directly to changes in preference. Preference is decomposed into its component parts of price, tangible benefits derived by the purchaser, and brand imagery issues, allowing the user to determine why the campaign was, or was not, effective in changing share of choice.
This paper extends earlier brand equity research by Dr. Gary Russell and Dr. Wagner Kamakura in the consumer product area (see MSI Report No. 91-110, April 1991) and more recently, work by Dr. Chan Su Park and Dr. V. Srinivasen (JMR, May 1994).
The Value Equation
We assume the total value of a brand in a particular product/service category is composed of three parts. One part is due to the physical and readily identifiable features of the brand that delivers specific, tangible benefits to the purchaser, thus impacting purchase choice. We call these the tangible product features. The second part is due to some perceived intrinsic value associated with the brand name due to such things as the image transferred to the purchaser, trust, longevity in the marketplace, social responsibility, consistent performance, and so forth (i.e. the intangibles), impacting purchase choice. We often refer to this as the brand's image, or the brand's equity. The third component is the price of the product. Thus, the total value (or utility) of a product or service for a purchaser is a function of its tangible, deliverable features, its brand equity, and its price. See figure 1.
Figure 1
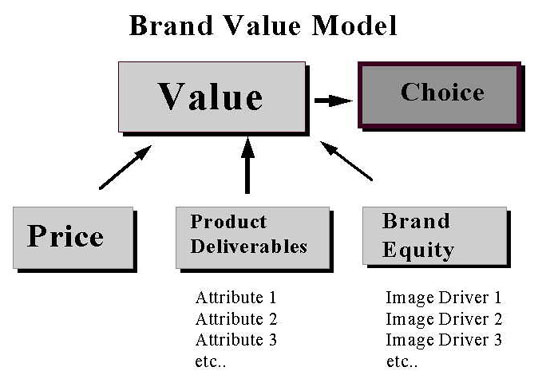
The degree to which these three factors contribute to brand value, the value equation, will be different for each product/service category. It also varies at the individual consumer level, which allows us to segment consumers based on their value equation.
In addition, we believe that a brand's value is directly related to customer choice, or switching behavior. That is, if a particular brand maintains a significantly higher perception of value to a consumer than any other brand in the category, that consumer will consistently purchase that brand. The source of that value is the combination of tangible features, intangible features and price. Conversely, as brands in a category become less differentiated in terms of both tangible and intangible features, price becomes the major differentiator of value. Thus, this model is closely aligned with the recent work by Frederick Reichheld (The Loyalty Effect).
Similarly, when a category does not allow premium prices, and offerings are similar in terms of tangible features, brand equity becomes the major differentiator of value.
The Brand Value Model shown in Figure 1 makes the following assumptions:
- Buyers are rational, thus they attempt to maximize value at any given purchase opportunity.
- The value a purchaser attributes to a particular product or service is equivalent to the total utility (in the economic sense) that person assigns to each product or service in their consideration set.
- Brand value to a purchaser is the sum of the utilities of:
- Product/Service Features - the bundle of tangible and readily identifiable features/attributes delivered by the product or service.
- Brand Image - the bundle of intrinsic features/attributes delivered by the product or service.
- The price of those two bundles of features/attributes.
We use conjoint models, linked with discrete choice models, to uncover brand equity. Thus, we also make the normal assumptions in all conjoint/choice models.
Modeling the Value Equation
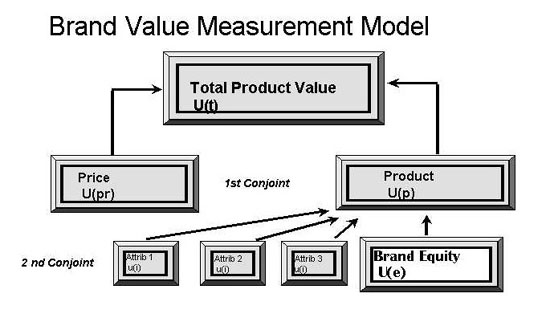
We estimate the utilities of tangible product features, brand equity, and price on an individual level by subjecting each respondent in a market research study to two conjoint tasks. The first conjoint task uses all relevant brand names in the category and a set of possible prices for each brand. From this task we estimate price utility (Upr), and total product utility (Up) for each brand and price level. In the first conjoint task, the brand name represents the sum of the utilities of both the tangible and intrinsic (intangible) features/attributes
.
It should be noted that one of the main reasons for this first conjoint task is to obtain an accurate estimate of the utility of price. When price is included in a conjoint task with many features, its utility tends to be understated, highly so in some cases.
We next subject each respondent to a second conjoint task which includes price, brand name, and tangible product features and levels of features that tend to drive purchase choice. This is typically a fractional factorial, main-effects, full-profile design conjoint. However, hybrid conjoint methods such as Adaptive Conjoint Analysis (ACA) can also be used when the number of key features exceeds an efficient design for full profile conjoint models.
From this data we derive utility estimates, at the respondent level, for price, each of the individual tangible product features (ui's), and brand equity (Ue), here represented by the brand's name. Price from the second conjoint exercise is then excluded from these calculations and utilities and importances are re-calculated. For a given product attribute profile, the sum of the ui's describing that product's features equals the utility of the product's tangible features (Up). This second task also gives us an estimate of the utilities for brand names, Ue, after we have taken into account the tangible features and excluded the impact of price from the second conjoint exercise. This is the brand's equity expressed in utils.
We then allocate the utility of product from the first conjoint task into the appropriate product features and brand equity in the second conjoint, using a re-scaling procedure. Figure 2. illustrates how the model works.
Figure 2
The third step in developing the model is to determine the drivers of brand equity. We ask respondents to rate each brand on a set of intrinsic attributes that we believe influence perceptions of brand equity in this category. Examples may include: a brand that enhances my self-image, trust, quality of advertising, contribution to the community, social responsibility, protecting the environment, and so forth. These ratings are then regressed against the derived brand equities (measured in utils).
The regression coefficients are then interpreted as weights of each attribute in driving brand equity. If the attribute set is highly intercorrelated, which is usually is, we use either a Bayasian regression or a key-driver model to derive the weights.
In order to closely align share of preference and share of choice we use a conjoint switching model. After the respondent provides a ranking of the various conjoint profiles in the second task, they are asked if they would switch from their current/usual product/service to their highest rated profile. If they say "yes", we ask the same question about their next most highest rated profile, and so on until say they would not switch. The difference in utility between their current product/service and the last product/service to which they would switch represents an estimate of the utility required to make any switch in the category.
By adding this information to the conjoint model, share of preference approaches share of choice, and we capture the utility that another product/service would have to overcome to elicit a switch under different product configurations.
Furthermore, we ask each respondent to describe each product or service that is in their consideration set, including the one they currently use, in terms of the attributes and levels of the conjoint design. This information is used to establish a "base case" for the model.
Applying the Value Equation to Measure Campaign Effectiveness
The value equation and the accompanying measurement model, as just described, can be used to measure the effectiveness of an advertising or promotional campaign, and track that effectiveness over time.
Theoretically, if we know a potential buyer's value equation and their perceptions of the current offerings before a campaign commences, then measure that same buyer's value equation and product evaluations during and after the campaign, we can attribute the changes in the value equation and perceived product performance to the effect of the campaign, given competing campaigns remain essentially unchanged during the test period.
Given the above, it seems reasonable to believe that an effective advertising campaign should do either of two things:
- Measurably change how the promoted brand is valued in terms of the consumers' value equations.
- Measurably change consumers' value equations.
Said differently, an effective promotional campaign can either change the way a promoted product is viewed in the category (given no change in the value equation), or change how a number of purchasers view the whole category, or both.
The reality of advertising and promotion is that effective campaigns often will do both - change how the promoted product is viewed, and change the way purchasers view the whole category (i.e. change their value equation).
If the purpose of the campaign is to promote a particular tangible attribute, then the promoted product should demonstrate improved perceptual performance on that attribute and that attribute may also show higher derived importance for all products in the category. Alternatively, if the campaign is designed to promote brand equity (i.e. the brand's image) then the image attributes addressed by the campaign should show higher importance and should be more closely associated with the advertised product.
In either case, the true test of the campaign's effectiveness is whether it changes share of choice, whether that change is driven by higher utility of the tangible attributes, a higher utility of the intangible attributes, or the evaluation of the promoted brand's performance on either the tangible or intangible attributes.
Unfortunately, this type of measurement requires interaction with the buyer and this intervention will most likely bias the results of later measurements. Thus, we recommend the use of independent, but matched, samples of relatively homogeneous buyers for each measurement period - one group prior to the campaign, one after the campaign, and as many as desired during the campaign. If the campaign is a long one, we also recommend the measurement of a second control group - those not exposed to the campaign - to account for any external changes that may have taken place during the measurement period.
Alternatively, the model can be executed in a controlled test environment for pre-testing campaigns. In this case, matched samples are selected. One is pre-tested only with the measurement model and the other is exposed to the campaign and then post-tested with the measurement model. The contrast between pre and post tests provide a definitive measure of the campaign's effectiveness and provides detailed diagnostics.
Furthermore, the measurement model can assist in the design phase of a campaign to highlight key issues that the campaign should focus on. The model can be used to identify the most important/effective product associations.
Example
Following is a heavily disguised example taken from a canned pet food category. Brand B, our promoted brand, broke a campaign on the health and nutrition benefits of its product. The results span a 16 week campaign period.
First we show changes in share of choice from respondents selected from a national, balanced panel of pet owners in figure 3.
Figure 3
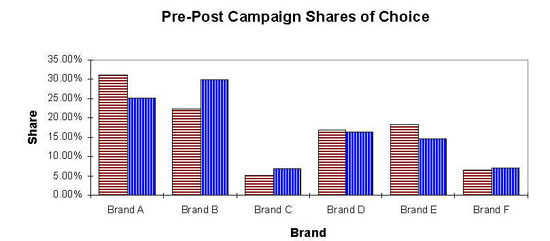
Here we see that Brand B, the promoted brand, improved share of choice from 22% to 30%. Brands A, D, and E showed a decline, while brands C and F showed a slight increase. Scanner data verified the direction and magnitude of the changes, in market.
The obvious question is what was the reason for the change in brand B - what elements of the campaign were most effective, and how much of the improvement was derived from a more positive evaluation of brand B and how much was due to changed perceptions in the category?
First, we examine a table of pre-post evaluations of brand B by respondents from a nationally balanced panel of pet owners. See table 1 following.
Table 1
Pre-Post Evaluations of Brand B by Panel of Pet Owners
| Description of Brand B |
|
Pre-Campaign
Frequency(%) |
Post-Campaign
Frequency(%) |
| Nutrition |
Complete/Balanced
Unsurpassed |
92.10%
7.90% |
67.82%
32.18% |
| Ease of Serving |
Is easy to serve
Is not easy to serve |
62.12%
37.88% |
64.34%
35.66% |
| Digestibility |
Is easy to digest
No mention |
58.02%
41.98% |
76.12%
23.88% |
| Fat |
Is low in fat
No mention |
38.88%
61.12% |
48.38%
51.62% |
| Natural Ingredients |
Made with all natural ingredients
No mention |
52.56%
47.44% |
48.41%
51.59% |
| Appearance |
Looks like canned pet food
Looks like people food |
88.12%
11.88% |
89.92%
10.08% |
| Form/Texture |
Form/Texture A
Form/Texture B
Form/Texture C |
53.56%
21.82%
24.62% |
48.18%
24.62%
26.69% |
| Daily Requirements |
Fulfills daily feeding reqmts.
Pampers |
81.01%
18.99% |
93.31%
6.69% |
| Eating Enthusiasm |
No mention
Brand pet eats very enthusiastically |
54.78%
45.33% |
51.11%
48.89% |
| Image |
Is a pet high-performance brand
Is a traditional, basic brand
Is a sophisticated, gourmet brand |
24.43%
71.76%
3.81% |
50.06%
31.24%
1.81% |
| Taste & Nutrition |
Provides more nutrition than taste
Provides balance of nutrition/tast
Provides more taste than nutrition |
18.51%
42.83%
31.24% |
58.18%
38.66%
10.58% |
In table 1 we see that brand B substantially improved their perceived performance on "unsurpassed nutrition", " easy to digest", "low in fat", "fulfills daily requirements", "is a high performance brand", and "provides more nutrition than taste." These increases were substantial by themselves, and accounted for over one-half of brand B's change in share of choice.
However, the campaign had a second effect. The brand B campaign actually changed average importances of the elements of the value equation for all respondents as illustrated below in figure 4.
Figure 4
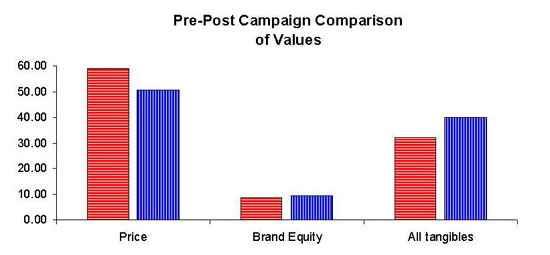
In table 4 we see that the both the tangible attributes, as a group, and brand equity became more important in consumers' value equation, at the expense of the importance of price. The changes accounted for over 40% of the change in brand B choice. More detail is provided in figure 5.
Figure 5
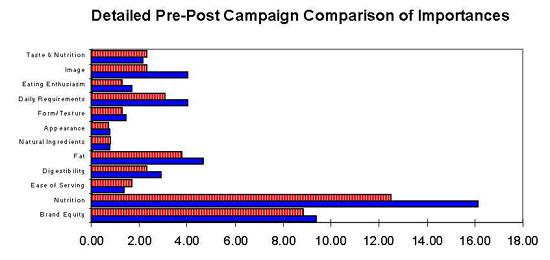
In figure 5 we see that brand B's campaign actually changed the importance respondents placed on several performance attributes for all products in the category, especially performance image of the brands, whether the brands meet complete daily requirements, having lower fat, and complete, balanced nutrition. The importance of brand equity also improved somewhat.
Thus, this campaign had the dual effect of improving the perceived performance of brand B, and in changing the way purchasers perceived the category.
As an aside, the changes in these derived importances explain why brands C and F increased share of choice during the brand B campaign.
Summary
This presentation addressed the issue of whether a promotional campaign improved the value of the product or service in the consumers' collective mind, thus increasing the number who would choose the product or service.
We introduced the brand value model and the brand value equation that demonstrates how product/service features, brand equity, and price drive share of choice.
We demonstrated how the measurement of brand value can be applied to test the effectiveness of a promotional campaign in a pre-test post-test scenario, and how that measurement system can differentiate between changing a brand's perceived performance and changing how consumers view the entire category.
|